"Jet Reports or Power BI?" is one of the most common Business Central reporting questions, and it's slightly the wrong question. They are built for different jobs. The honest answer, for most finance teams, is both — and the reason that isn't a cop-out is worth understanding before you spend money on either.
The core difference
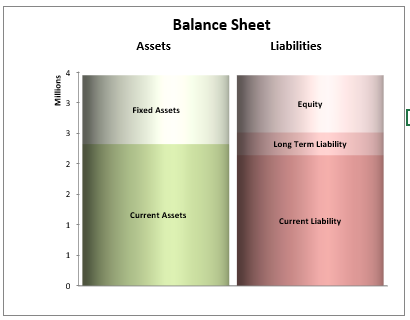
Jet Reports lives in Excel. It is built for detailed, structured, drillable financial and operational reports — management accounts, month-end packs, aged debt — where the numbers must tie back and someone needs to trace a figure line by line. This is a Jet-produced balance sheet, refreshed from live ERP data:
Power BI is a visualisation and analytics tool. It is built for interactive charts, trends and self-service exploration across the business — strong for KPIs and spotting patterns, weaker for a formatted statutory report your accountant signs off.
Which fits which job
| What you need | Better fit | Why |
|---|---|---|
| Formatted P&L / balance sheet | Jet Reports | Excel formatting and finance-grade layout |
| Interactive KPI dashboard | Power BI | Built for visual exploration |
| Drill to individual transactions | Jet Reports | Direct line-level ERP detail |
| Company-wide self-service analytics | Power BI | Sharing and interactivity at scale |
| Month-end pack finance signs off | Jet Reports | Reconciles and reproduces exactly |
| Blending Dynamics with other systems | Power BI | Multi-source by design |
Why it's usually both
Most Dynamics teams settle on Jet Reports for finance reporting and Power BI for dashboards. That isn't indecision — the two audiences genuinely want different things. Finance wants a number it can defend. The board wants a trend it can read at a glance.
Where a Jet Analytics warehouse exists underneath, it can feed both from one governed source, so the figures reconcile wherever they appear. That is the setup worth aiming at, and the one that avoids the worst outcome: two tools disagreeing, and nobody sure which is right.
The factor that matters more than the choice
In our experience the deciding variable is rarely the product. It is whether the tool was ever set up properly. A well-configured Jet Reports beats a badly-configured Power BI comfortably, and the reverse is just as true.
Most reporting complaints we're called about turn out to be configuration problems wearing a product-choice costume: dimensions never mapped, a chart of accounts that doesn't roll up cleanly, reports built by someone who left. Switching tools doesn't fix any of that — it just moves it, at some expense.
If you're weighing the two, it's worth asking what your current reporting would look like if it had been finished properly. Quite often that answer removes the need to choose at all.
Frequently asked
Can Power BI produce a statutory P&L?
Can Jet Reports do dashboards?
Do we need Jet Analytics to use both?
Which is cheaper?
We'll give you a straight recommendation — Jet, Power BI, or both.
Book a free reporting review