The account schedules vs Jet Reports question usually arrives the same way: someone has built a P&L in Business Central, it mostly works, and it is still being copied into Excel every month before anyone will send it to the board. The answer is not automatically "buy the add-in".
Start native. Move when you hit one of five specific walls - and check first that the wall is really the tool.
First, the naming - because it trips people up
If you are on a recent version of Business Central, Account Schedules are now called Financial Reports. Microsoft renamed the feature (2023 release wave 1); the underlying mechanics - row definitions, column definitions, analysis views for dimensions - are the same thing you already know. Older documentation, most consultants and half the internet still say account schedules, so both terms are used interchangeably here.
What native financial reporting genuinely does well
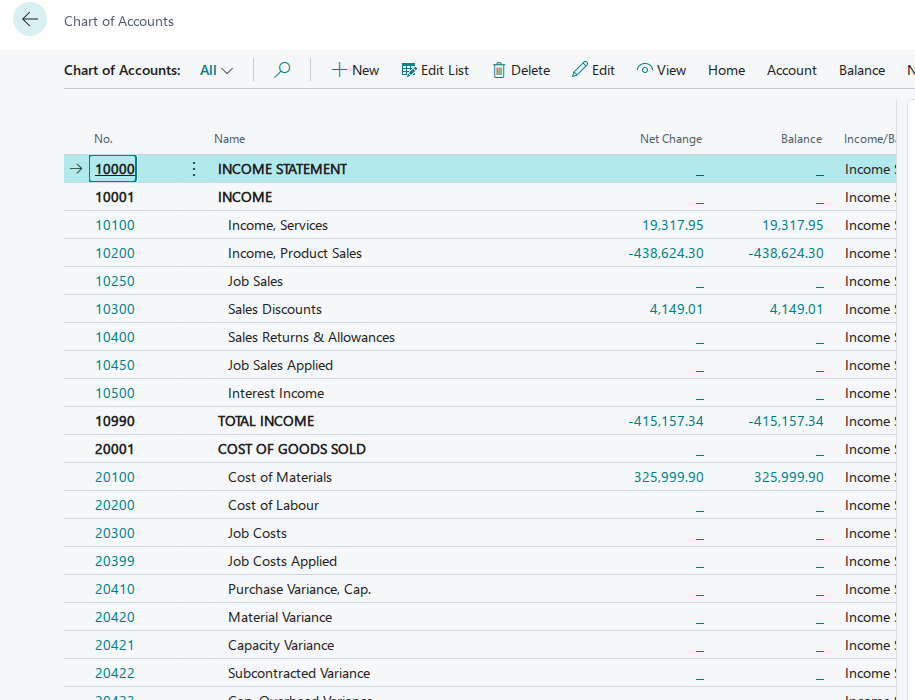
- Statutory-shaped statements - P&L, balance sheet, trial balance - built from row and column definitions you control.
- Budget against actual, variance columns and comparative periods without any external tool.
- Drill-down to the entries, which is what makes a number defensible in a meeting.
- Dimension filtering, through analysis views, for departmental or project cuts.
- No extra licence, no extra install, and it lives where the data lives.
For a single company with a clean chart of accounts and a finance team that reads reports inside Business Central, this is often the whole answer. A surprising number of "we need a reporting tool" conversations end here, with two hours of row-definition work instead of a purchase.
The five walls that send teams to an add-in
1. The report is not GL-only
Account schedules read general ledger figures. The moment the pack needs sales lines by customer, stock valuation detail, open jobs, aged debt by salesperson or anything living in a subledger table, you are outside what the feature is built for. This is the single most common trigger, and it is a genuine capability boundary rather than a preference.
2. The layout matters as much as the numbers
A board pack with a specific house layout, mixed commentary, several statements on one tab and a chart beside the table is an Excel document. You can approximate it natively and then spend every month restoring the formatting - which is precisely the manual step you were trying to remove.
3. Several companies that need consolidating
Multi-entity consolidation with eliminations and inter-company detail is where native reporting starts costing more in workarounds than an add-in costs in licence. If you run three or more legal entities and report on them together every month, this wall arrives quickly.
4. Dimension combinations outgrow analysis views
Analysis views work, but each meaningful combination is another object to define and maintain, and they need updating to stay current. Once the finance team is requesting cuts faster than anyone maintains the views, the model is no longer serving you.
5. Finance lives in Excel and always will
This one is cultural, and it is not a failing. If every number ends up in Excel regardless, a tool that refreshes in Excel removes the manual export step that causes most month-end errors. That is the actual value on offer - not prettier reports, but the elimination of copy-paste.
Side by side, by job
| The job | Native financial reports | Jet Reports |
|---|---|---|
| Statutory P&L and balance sheet | Strong - built for it | Also strong |
| Budget vs actual, comparatives | Strong | Strong |
| Drill to individual GL entries | Strong | Strong |
| Subledger detail (sales, stock, jobs) | Not its job | Strong |
| Precise Excel-native layout / board pack | Limited | Strong |
| Multi-company consolidation | Workaround territory | Strong |
| Wide dimension slicing on demand | Analysis view upkeep | Strong |
| Cost | Included | Licence plus setup |
| Who can maintain it | BC-literate finance user | Excel-literate finance user |
When switching is the wrong answer
Three situations where an add-in will disappoint you, and we will say so before you spend anything:
- The chart of accounts does not roll up cleanly. Every reporting tool inherits that. You will simply see the mess faster, in Excel.
- Dimensions are not being posted consistently. If half the transactions carry a department and half do not, no tool can slice by department honestly.
- The real problem is that nobody owns reporting. New tool, same orphaned reports, eighteen months later.
A migration path that does not break trust
If you do move, keep the native report alive while you build the replacement. It is your reconciliation baseline, and it is the only cheap way to prove the new pack is right.
- Pick the one report costing the most manual time. Not the whole pack.
- Rebuild it in the add-in, refreshing from live data.
- Run both for a full month and tie out every line to the native report.
- Only when they agree, retire the manual version - and write down who now owns it.
- Repeat for the next report, in cost-of-time order.
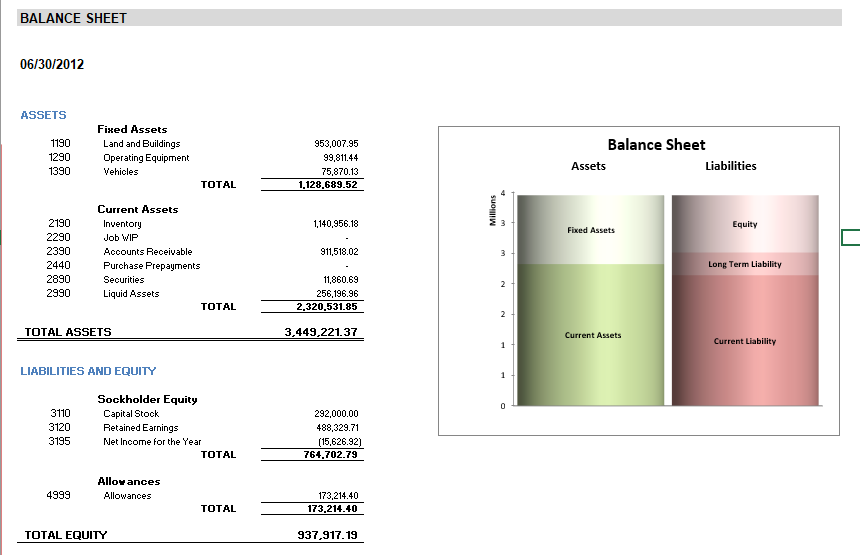
Done in that order, the switch is provable at every step. Done as a big-bang rebuild, you get a month-end where two versions disagree and nobody can say which is right - which is a worse position than the copy-paste you started with.
Frequently asked
Are account schedules being removed from Business Central?
Can Jet Reports read my existing account schedule definitions?
Do we need Jet Analytics as well?
Would Power BI solve this instead?
That is exactly what a free reporting review is for - and it is often the cheaper answer.
Book a free reporting review